
Public Health England has released provisional estimates of life expectancy at birth for 2020 to show the impact of the COVID-19 pandemic in England and its regions.
Despite their name, these estimates of life expectancy at birth are not in fact projections or predictions of how long babies born in 2020 can actually expect to live.
The estimates for 2020 are instead the average number of years a newborn baby would live if they experienced the national (or regional) age-specific mortality rates for 2020 throughout their life.
As mortality rates will change in the future, the figures are not a forecast of future life expectancy but provide instead a snapshot of current mortality rates.
These life expectancy estimates are therefore an alternative way of presenting mortality rates in order to show the impact of COVID-19 on levels of mortality, and inequality in mortality, in 2020.
Data for areas grouped by their level of deprivation also provides new evidence of how the pandemic has worsened existing health inequalities.
The provisional estimates show that life expectancy in England in 2020 was 78.7 years for males and 82.7 years for females.
PHE’s weekly excess mortality reports show that between the start of the pandemic in March 2020 and the end of 2020, there were almost 70,000 excess deaths in England.
Given the very high level of excess deaths last year due to the COVID-19 pandemic, it is no surprise that life expectancy fell in 2020. Compared with 2019, life expectancy in England in 2020 was 1.3 years lower for males and 0.9 years lower for females. These falls exceed any previous year-on-year changes seen since 1981. (This is the first year for which we have data calculated in a comparable way to these latest estimates.)
Estimates for the first six months of 2020, covering most of the first wave of the pandemic, show even bigger falls in life expectancy but the estimates for the second half of the year were closer to those in 2019.
Provisional life expectancy in England, 2015 to 2020, by sex
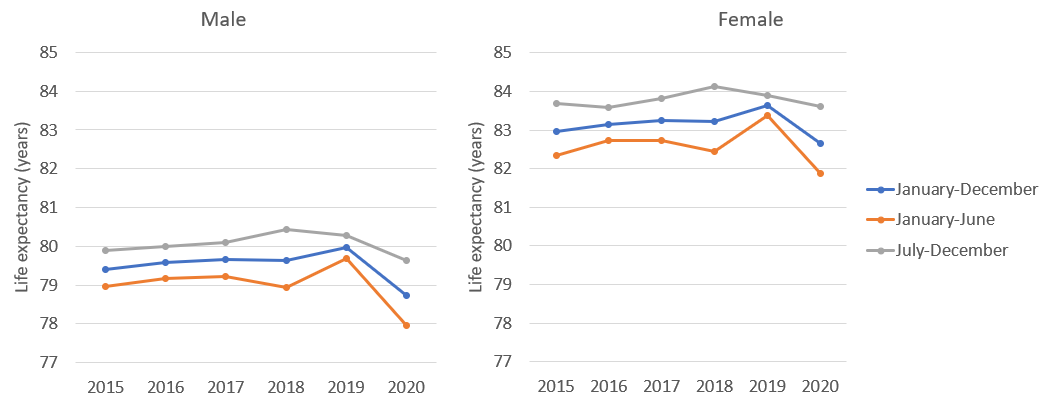
Source: Data from PHE’s Wider Impacts of COVID-19 on Health monitoring tool
This drop in life expectancy has not been experienced equally in England, however. The fall was bigger for males than females, confirming what we already know, that there has been greater mortality from COVID-19 in men than women.
There have also been geographical inequalities. Among the English regions, the biggest fall was in London, where male life expectancy fell by 2.5 years between 2019 and 2020. In the South West, the fall for males was only 0.6 years.
For females, the biggest fall in life expectancy in 2020 was also in London, at 1.6 years, while the smallest fall was 0.5 years in the East of England.
Provisional life expectancy in English regions, 2015 to 2020, by sex
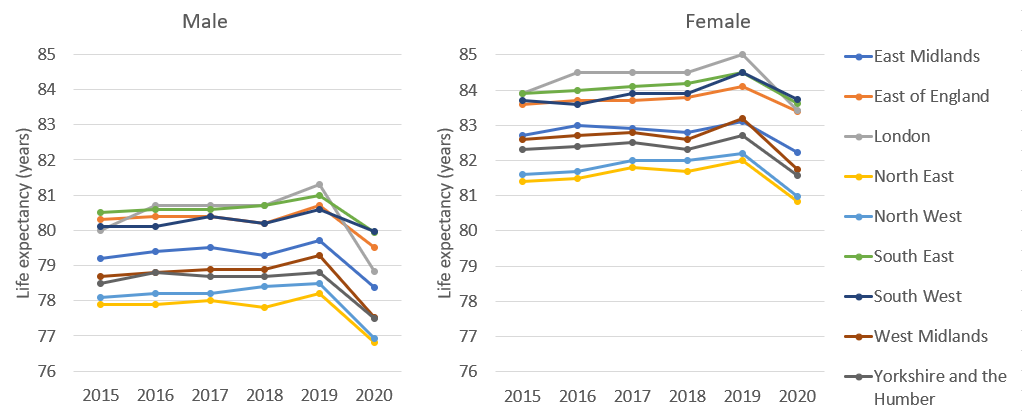
Source: Data from PHE’s Wider Impacts of COVID-19 on Health monitoring tool
Inequality can also be measured by dividing the population into 10 groups, with the most deprived tenth of the population in the first group and the least deprived tenth of the population in the tenth group. Inequality between the most and least deprived can be summarised in a measure called the Slope Index of Inequality (which was described in an earlier blog.) The higher the value of the slope, the greater the level of inequality within an area.
Between 2019 and 2020, for both sexes, life expectancy fell in all the deprivation groups. However, it fell by more in the most deprived areas, which resulted in an increase in inequality in 2020.
PHE’s review of inequalities during the first wave of the pandemic, noted that the impact of COVID-19 had in some cases increased existing health inequalities. The release of these life expectancy estimates provides further evidence that the pandemic has exacerbated existing inequalities, based on data for the whole of last year.
The gap in male life expectancy between the most and least deprived areas in England in 2020 was 10.3 years, 1 year larger than in 2019.
For females, the inequality gap in 2020 was 8.3 years, 0.6 years larger than 2019.
Provisional slope index of inequality in life expectancy in England, 2015 to 2020, by sex
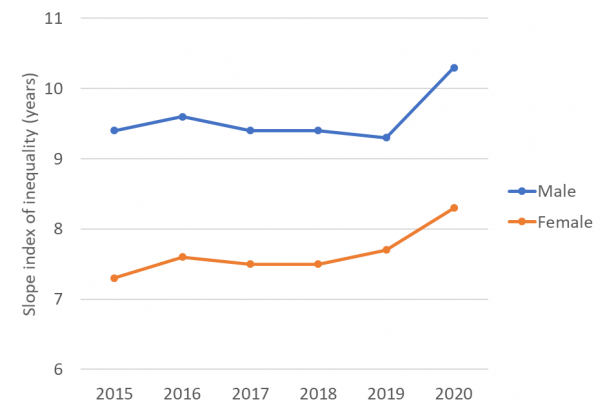
Source: Data from PHE’s Wider Impacts of COVID-19 on Health monitoring tool
The inequality gap can also be measured within regions, as well as within England as a whole. For males, there was a statistically significant widening of inequality between 2019 and 2020 in London, the North West and West Midlands. For females, there was a significant widening of the gap in the East Midlands, London, and West Midlands. In other regions, there was no significant change in inequality between 2019 and 2020.
These provisional estimates have been calculated by PHE using provisional mortality data and population estimates from the Office for National Statistics, and deprivation scores from the Ministry of Housing, Communities and Local Government. Further details can be found in the Wider Impacts of COVID-19 on Health monitoring tool.
View original article
Contributor: Allan Baker