
Today we have published new estimates, based on an updated methodology, on the deaths and hospital admissions caused by smoking. The figures are around 15% lower than previously published but what does this tell us about smoking in England?
Why do the estimates of death and disease caused by smoking appear to have gone down so sharply?
Cigarettes remain the most dangerous consumer product known to man. It had been estimated that half of lifelong smokers would die as a result, but a 2015 study suggests that the figure might be as high as two thirds. So why have the estimates of the number of deaths and hospital admissions caused by smoking gone down?
We make our estimates based on a complex method where we look at the fraction of deaths or hospital admissions that are likely to be caused by smoking.
Smokers are much more likely than non-smokers to get a wide range of diseases including respiratory diseases, cardiovascular diseases and a wide range of cancers. For these conditions, it is possible to calculate the risk of them occurring in smokers compared to non-smokers. This is called a relative risk and is specific to each disease, age group and sex. To work out the fraction of deaths and admissions attributable specifically to smoking we combine these relative risks with the most recent smoking prevalence for each local authority.
The amount of death and disease caused by smoking hasn’t suddenly reduced, but the information we use to estimate it has been updated. The previous relative risks were based on data from 1982 to 1988. Since then a variety of studies have been undertaken that examine to what extent smoking is a risk factor for a number of conditions. Using the latest scientific evidence and especially the report Hiding in Plain Sight (HiPS) from the Royal College of Physicians, our estimates of the number of smoking related deaths and hospital admissions are lower than in the past.
To make sure that people can compare like with like we have also calculated the figures for previous years on this basis.
The burden of smoking attributable death and disease has changed little over recent years. Figure 1 shows the recent trend for smoking attributable mortality calculated using both the old and new methods. The direction of travel is broadly the same.
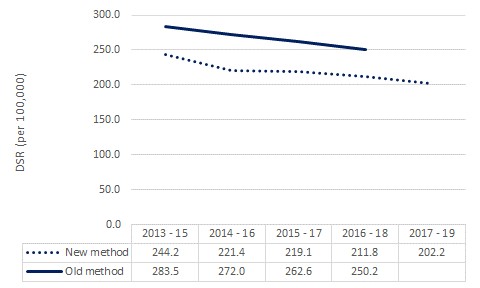
Figure 1: Smoking attributable mortality, new method vs. old method, England
Why does this suddenly appear the same month as the government’s new tobacco control plan was due?
This work has been in the pipeline for over three years. The RCP’s HiPS report was published in 2018 and was a monumentally thorough recalculation of the risk associated with smoking in the UK that made us wonder if it was time to update our calculations of smoking attributable deaths and hospital admissions. We consulted on our initial proposals in September 2020 and after a 5 month consultation, we published our response.
Does that mean the past estimates were artificially high?
With the updated methodology we have improved the accuracy of the estimate of deaths and admissions that are attributable to smoking. Previously, we were using the widely accepted evidence at the time and once the new data from the RCP report were available, we started to look at how that would affect our estimates of deaths and hospital admissions.
The RCP included 17 cancers, 8 respiratory conditions, 7 mental health conditions and more in their report. The current estimates are the most accurate we have produced.
There are almost half a million smoking related hospital admissions each year in England. What matters most is that we can reliably compare one year to the next so that we can measure our progress. For that reason, it is better to change the methods from time to time but not every year.
So how much of a difference does this make to the figures?
The number of smokers aren’t affected, nor is the likelihood that a smoker will die as a result of smoking. About 1 in 7 adults smoke and around 2 in 3 lifelong smokers will die of smoking related deaths.
What has changed is the estimated number of deaths and hospital admissions for various smoking related diseases that we attribute to smoking. Using our new method our estimate for last year is approximately 15% lower than we had made previously.
Figure 2 shows the difference in the number of deaths attributed to smoking by condition group using the old and new methods for the years 2016-18.
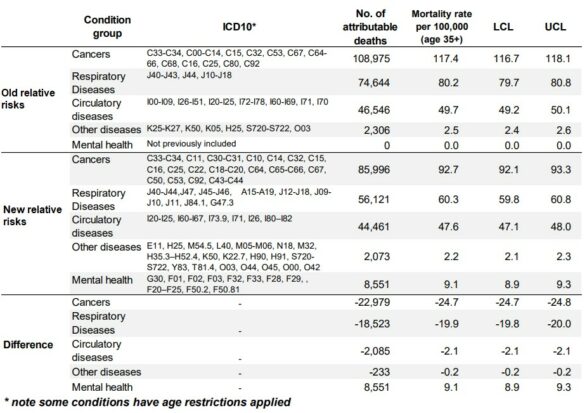
Figure 2: Smoking-attributable mortality in 2016-2018 comparison by condition group, England
Doesn’t this mean smoking is less harmful than we thought and how does this compare with alcohol and obesity?
At an individual level, how lethal smoking is has not changed – if you were smoking 20 a day last year and continue to do so this year then you will experience the same amount of harm. What has changed is our estimate of the total number of deaths and hospital admissions in England caused by smoking. Not long ago, more deaths in England were caused by smoking alone than by alcohol, obesity, drug use and AIDS combined. Last year about as many people in England died from smoking as died from COVID-19. As the number of smokers declines the total burden of death and disease in England will fall too.
View original article
Contributor: Martin Dockrell