
Obesity is a global and complex public health concern. It is associated with reduced life expectancy and is a risk factor for a range of chronic diseases, including cardiovascular disease, type 2 diabetes, at least 12 kinds of cancer, liver and respiratory disease, and can also impact on mental health.
As we now know that excess weight also appears to put individuals at risk of a worse outcome from COVID-19, it is now more important than ever that we continue to monitor the levels of people living with excess weight in the population. Understanding the data, the trends and patterns enables us to make the case for national and local action, which includes policy and approaches to create health promoting environments; healthier food and activity options; social marketing campaigns to support behaviour change; and to work with partners to design and tailor approaches to meet needs of particular groups of people.
Preventing obesity and putting in place support for people living with overweight or obesity is a priority for the Government. In July 2020 the Department of Health and Social Care published a strategy which outlines actions the government will take to tackle the causes of obesity and help adults and children to live healthier lives.
The proportion of adults in England living with obesity has seen large increases in the last four decades. Analysis of data from the 1980 National Heights and Weights Survey estimates that the prevalence of obesity in England stood at 6% of men and 9% of women aged 16 and over with 0.1% of men and 0.4% of women living with severe obesity. In 1993 the Health Survey for England reported that the prevalence of obesity among men and women in this age group was 13% and 16% respectively which has increased to 27% of men and 29% of women in 2019.
This blog sets out a range of resources from Public Health England that present the latest data on the patterns and trends in the prevalence of overweight and obesity in the adult population. These resources are useful to public health practitioners and policy makers working to reduce and prevent excess weight in adults at local, regional and national level.
The patterns and trends in adult excess weight slide set
The patterns and trends in adult excess weight slide set presents the latest data from the Health Survey for England. Although it relates to data collected before COVID-19, the most recently available data is from the 2019 Health Survey for England and was published in December 2020.
The prevalence of severe obesity has increased since 1993 for both men and women. Overall, a very small proportion of the population are living with severe obesity but the rise in prevalence has been substantial since 1993 to 1995 (combined); a 7-fold increase for men (increasing from 0.3% to 2.2% in 2017 to 2019 combined) and a 3-fold increase for women (increasing from 1.5% to 4.5% in 2017 to 2019).
Trend in the prevalence of severe obesity among adults (aged 16 and over) in England 1993-2019
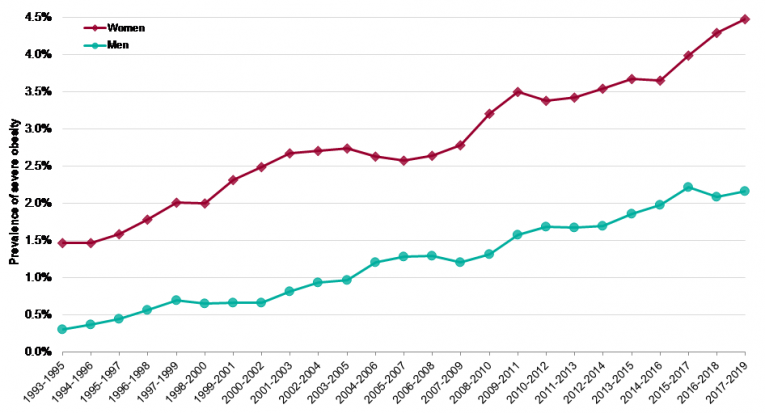
Source: Health Survey for England 1993 to 2019 (three-year averages), NHS Digital
Inequalities are seen in the prevalence of obesity and to a greater extent in women than men; 39.5% of women in the most deprived areas of England were living with obesity compared with 21.9% in the least deprived areas.
Prevalence of adult (aged 16 and over) obesity by deprivation quintile, England 2019

Source: Health Survey for England 2019, NHS Digital (95% confidence intervals are shown on the chart)
Regional trends in the prevalence of obesity in adults 1993-2019
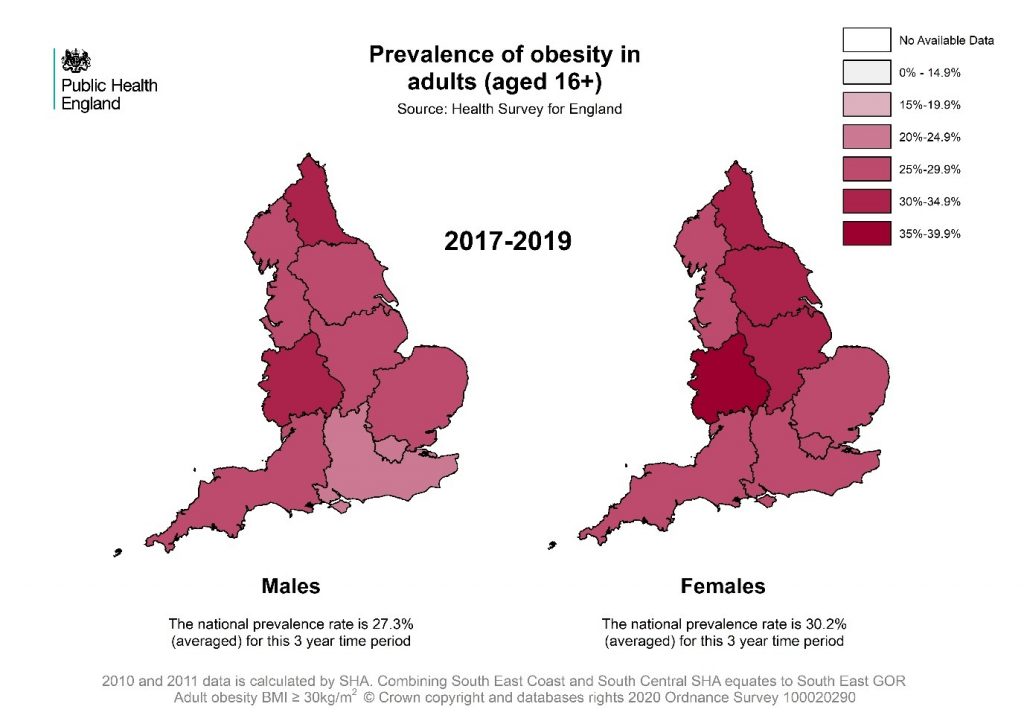
Screenshot of the first and last maps shown in the trend animation
Note: Data is age standardised to minimise the effects of different age structures between regions
This is an animated time series map of England showing the change in prevalence of obesity in adults (aged 16 and over) for sub national geographies from 1993 to 2019 using data from the Health Survey for England. The map visualises the increasing levels of obesity prevalence seen across England over the last 27 years. The proportion of adults living with obesity varies by region but has seen large increases across all areas in England.
The latest data for 2019 shows that the prevalence of obesity was highest in the North East and West Midlands (34% of adults) and was lowest in the South East (24%) and London (23%).
Change in the distribution of body mass index (BMI) in adults 1993-2018
Rather than just looking at the proportion of adults in each BMI category it is interesting to view the whole distribution of BMI for the adult population and compare the shape between men and women and over time. Mean BMI in the adult population has increased from 25.8kg/m2 in 1993 to 27.6 kg/m2 in 2019.
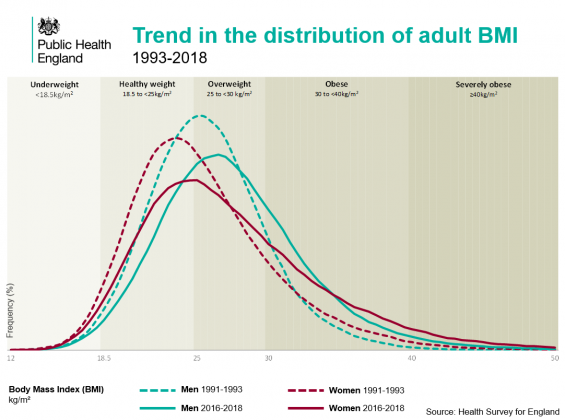
Final chart in the BMI distribution trend animation
This animated chart shows the change in the body mass index (BMI) distribution among men and women aged 18 years and over using data from the Health Survey for England. This data has been standardised to the English population at the time of measurement and therefore represent the BMI distribution within the adult population at that time.
Over the last 26 years the BMI curve has gradually shifted to the right for both men and women indicating an increasing number of adults with a higher BMI.
The 2016 to 2018 data shows that a higher proportion of women are underweight or a healthy weight than men, but as BMI increases the pattern changes and a higher proportion of men than women are overweight or living with obesity. This chart makes it very clear that many men and women have a BMI much greater than the ‘healthy weight’ range (18.5 to 25). In addition, many adults living with obesity have a BMI much higher than 30.
View original article
Contributor: Caroline Hancock