Influenza (flu) kills an average of 8,000 people every year, and it can be particularly serious in older adults, very young children, and people with underlying health conditions. Our ability to accurately monitor levels of influenza throughout the winter season play an integral part in informing current and future public health decisions.
Public Health England (PHE) has one of the most advanced public health systems for influenza surveillance in the world, using multiple data sources to establish a more holistic understanding of flu activity across the season. In this blog we take a closer look at what tools we use to monitor flu each winter, and how this information informs our public health approaches.
In the lab
Each year, the World Health Organisation (WHO) analyses flu strains circulating in the Northern Hemisphere winter to make recommendations about what flu strains should be included in the flu vaccine for the subsequent Northern Hemisphere winter.
This can only ever be a prediction – the vaccine needs to be prepared in advance, usually six months ahead of when flu actually starts circulating in this country. So, when the flu season does begin in England, our Virus Reference Laboratory carries out analysis of the flu samples we receive, such as genetic sequencing to determine whether the circulating flu strains are similar to the vaccine strains. Further work is also undertaken to combine these laboratory flu results with the vaccination history of the patients from whom the samples were taken to estimate how well the vaccine is working.
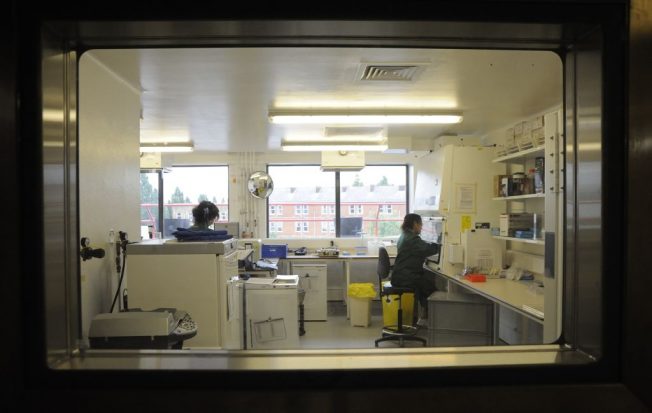
PHE scientists working inside a laboratory at Colindale, London.
Real-time Syndromic Surveillance
PHE’s Real-time Syndromic Surveillance Team (ReSST) collect and analyse anonymised health data from several sources across England. These health data are based on symptoms presented by patients rather than laboratory tests for particular bugs.
The team use these data each day to look for changing trends indicating higher-than-usual levels of illness in the population. These results are published in weekly bulletins to keep public health professionals up to date.
Throughout the winter, the team monitor a range of different indicators from their data sources, including: GP consultations for influenza-like illness (ILI); NHS 111 calls for ‘cold and flu’ symptoms; emergency department attendances for respiratory infections and ILI. Each of these indicators form an integral part of the team’s work and are fed into the PHE National Influenza Report alongside other sources of flu information.
We track symptoms rather than confirmed cases of flu because it can be much more rapid than processing a sample in the laboratory. Our syndromic systems monitor patients who presented to a healthcare professional the previous day. Also, only a very small fraction of people with flu will have a sample taken for testing, and these people can be from certain sections of the population, such as the elderly or those in hospital, which doesn’t give us a representative measure of what flu is doing in the general population. Therefore, ILI rates from community-based surveillance systems do give us a better measure of the proportion of the population experiencing flu-like symptoms in a given period of time.
However, it is important to remember that a variety of infections, including flu, can cause ILI symptoms, and also that our health care-based surveillance systems only pick up the more severe cases seeking medical attention in GP surgeries and hospitals. It is a useful way to compare trends in groups of people over time, place and other factors such as age and sex. However, using ILI rates to calculate an overall number of people with “flu” in the population will not provide an accurate picture. Rates do however allow comparisons to be made unlike overall numbers as they account for the differences in population sizes.
Let me Google that
We know that not everyone who gets flu will necessarily visit their GP or phone NHS 111. However, many of us that do get ill might turn to the internet to help find information and tips to speed up recovery. PHE has teamed up with researchers at University College London (UCL) to collect anonymised and aggregated search data from the Google internet search engine to build real-time estimates of ILI in the population. These data are produced based on the proportion of ILI related search queries within a 10%-15% sample of all Google queries. This system – known as the FluDetector project – has found that when appropriately modelled, online search data can be an accurate estimator of ILI rates in primary care.
This new approach has huge potential to enhance our real-time syndromic surveillance capabilities, capturing a broader segment of the population than just those who have consulted the healthcare system. And unlike GP consultations, it is not affected by weekend or holiday closures.
Survey says
The FluSurvey is an on-line survey, set up during the swine flu pandemic in 2009 as an indicator of flu activity in the community. Around 7,500 people around the country are currently registered with FluSurvey and, during the winter, they voluntarily report if they have had flu-like symptoms during the previous week. While the numbers at a local level are small and should be treated with caution, it is another tool that enables PHE to monitor flu levels through winter across the country.
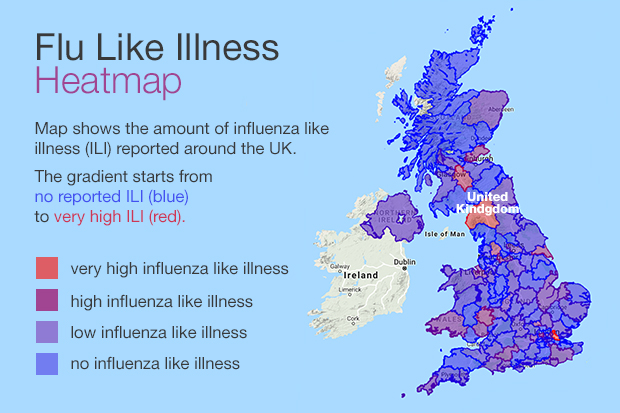
Flu survey map showing the amount of influenza like illness (ILI) across England on 8 January 2020
What happens to the data?
Evidence from these surveillance systems, along with GP ILI consultation data from the Royal College of GPs sentinel surveillance network, care home outbreak data and NHS Trusts on flu hospitalisations is used to build a comprehensive picture of the flu season in England.
The data are analysed and interpreted into key messages in the PHE National Influenza Report. The enhanced flu surveillance undertaken by PHE takes place between October and April each year, the period during which historically most seasonal flu activity occurs. In the early part of winter this enables us to monitor when the flu season ‘starts’, triggering advice from the Chief Medical Officer to doctors on the prescribing of flu anti-viral drugs.
As the season progresses, the data enable us to monitor the different types of flu circulating (e.g. flu A, flu B), which parts of the country are being affected, which age groups the flu is particularly affecting and in general how severe the season is. All of this intelligence helps to ensure that there is enough resilience in place within the NHS to cope with the pressure from flu. As better modelling systems develop, data from our surveillance systems may be able to provide a more accurate flu ‘forecast’ or detect breakouts earlier at both the national and local level.
Flu is highly infectious and affects thousands of people every season. By drawing on multiple sources of data from across NHS and non-NHS systems, PHE’s world leading flu surveillance system provides a holistic picture, better informing public health decisions.
View original article
Contributor: Jamie Lopez Bernal