Coloured transmission electron micrograph (TEM) of a SARS-CoV-2 coronavirus particle isolated from a UK case of the disease Covid-19. SARS-CoV-2.
One of PHE’s core functions is disease surveillance; making sure we have the right information available to us at the right time to inform decisions and actions across the public health system.
Surveillance involves gathering a wide variety of data about a disease from a range of sources, to provide us with situational awareness.
We need to understand the areas of the country which are most affected by an outbreak of disease, whether particular groups of people are affected, whether symptoms are getting more severe and when the outbreak might have peaked. This is then used to inform public health action to help prevent and control the disease.
And surveillance also provides data to be used by modellers; scientists who aim to predict how outbreaks will progress based on a range of different scenarios.
This blog will focus purely on COVID-19, but it’s important to know that surveillance is a well-established part of PHE’s day to day work. You can read about our approach to tracking seasonal flu in this recent blog.
COVID-19 surveillance
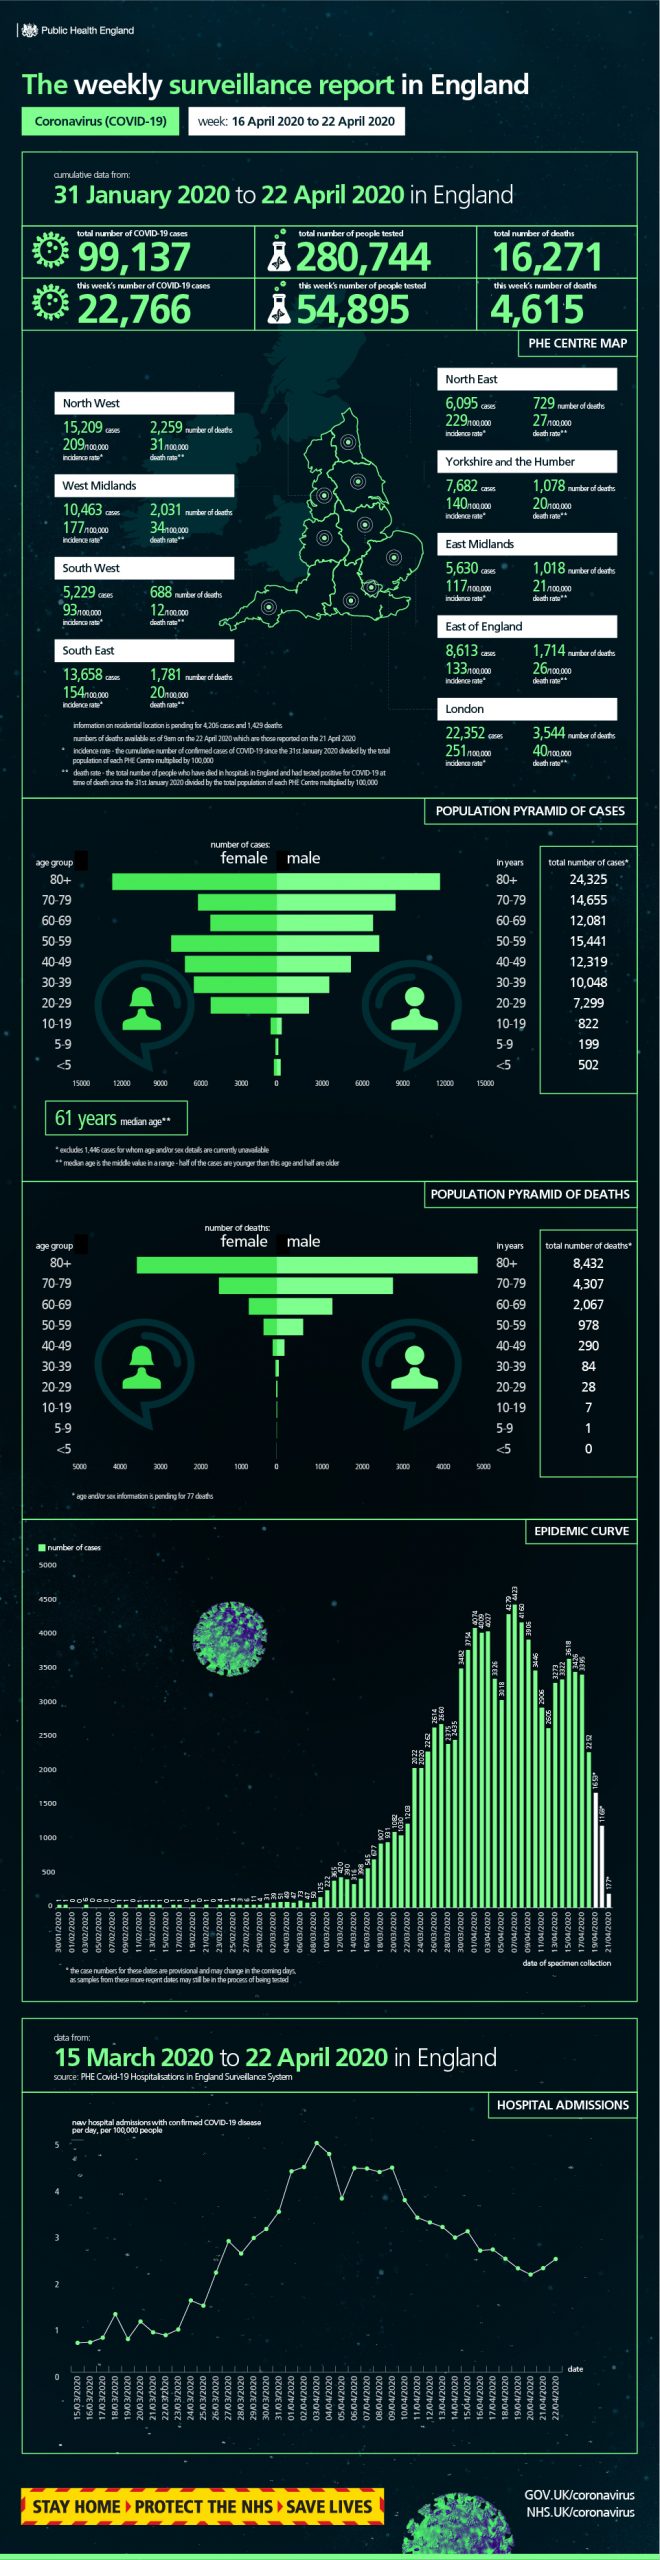
To help understand the spread of COVID-19, PHE uses a wide variety of real-time data at both local and national level, and in order to keep the public health system informed about the data we’ve been collecting, we are now publishing a weekly surveillance report and weekly infographic.
In this blog we want to explain what the report contains, setting out the mix of data we use based both on cases of coronavirus confirmed by laboratories, but also “syndromic surveillance” which uses anonymised real-time health data collected from a wide range of sources, such as GPs, hospitals or even Google searches.
Surveillance systems are chosen so they can be measured regularly and consistently. No single piece of data tells the whole story of any outbreak, nor can any system provide a definitive figure for exactly how many people could have COVID-19 as many will have a mild illness and never report it to the health services.
By bringing together a wide range of data we can make well informed judgements about emerging trends, geographical variations and the groups of people most affected.
Confirmed cases in England
Our weekly surveillance report includes a page on laboratory confirmed cases of COVID-19 in England that includes an age/sex breakdown. An epidemic curve showing the progression of cases over time is also included on the infographic.
The data are shown by the date the specimen was taken from the person being tested, rather than the date the lab carried out testing and sent data to PHE. While this gives the most accurate analysis of how the cases progress over time it does mean that the latest days’ figures are usually incomplete – so it shouldn’t be seen as a sudden large drop in cases.
It’s also important to remember that most testing to date has been offered to those in hospital with a medical need as well as NHS key workers, rather than the general population, many with mild symptoms. So confirmed cases represent the typical population of people with severe disease, rather than all of those who get infected.
This is a weekly total rather than the latest daily update, so to stay up to date with daily confirmed cases please use our dashboard which is updated every afternoon.
Our surveillance report also breaks down confirmed COVID-19 cases by PHE centre (PHE has 9 centres based across the country) and NHS region.
Community surveillance
PHE has a network of health protection teams across the country made up of scientists and experts trained to manage infectious disease outbreaks. These teams are constantly on the lookout for outbreaks in venues like schools or care homes and collecting this information is vital at both local level and to inform our national response.
The weekly surveillance report brings together the information provided by our health protection teams such as any “acute respiratory outbreaks” in a community setting, including cases where coronavirus has been confirmed.
As we move out of the winter season and infections like flu become less prevalent, we would expect most outbreaks in community settings to be related to COVID-19 (an “outbreak” is defined as two or more people experiencing a similar illness, which appears to be linked to a place).
However, we also know that not everyone who gets COVID-19 will necessarily report their symptoms to a doctor or phone NHS 111, but many might turn to the internet to help find information and tips to speed up their recovery.
Our internet-based surveillance tracks the volumes of people searching for typical symptoms of coronavirus on search engines like Google, and we look out for evidence that numbers of these searches are increasing above expected levels.
Finally, our online FluSurvey is completed by the public and tracks self-reported respiratory symptoms. The tool has now been adapted to monitor community prevalence and trend of symptoms related to Covid-19.
Primary care surveillance
Our surveillance activity includes a range of data submitted by GPs across the country.
The PHE GP in-hours system monitors the daily number of GP consultations where patients have a presented with a range of respiratory symptoms including COVID-19 cases. This scheme has very wide coverage of the England population with around 4500 GP surgeries (covering a patient population of around 40 million) reporting into it each day.
And our GP Out-of-Hours system monitors the numbers of daily unscheduled visits and calls to out-of-hours GP services across England, particularly during evenings, overnight, on weekends and on public holidays, again where patients report they have respiratory symptoms.
Together these schemes provide vital intelligence from around the country about the number of people who are showing the signs and symptoms of coronavirus.
It’s important to point out that when looking at these figures, we take account of the fact that official Government advice has urged people who believe they have coronavirus to contact NHS 111 or visit nhs.net, rather than going to their GP.
The primary care (GP) schemes above offer us data based on the clinical judgment of GPs who record whether their patient has presented with respiratory illness, but we also run a primary care scheme which involves laboratory testing of patients.
The RCGP Swabbing Scheme sees GPs taking swabs from patients, or asking patients to swab themselves, when the consult a GP for respiratory symptoms – this comes from a sample of around 200 GP practices. This provides us with a test “positivity rate” which we can monitor week by week, by age and by region to see if the proportion of people with confirmed COVID-19 increases. This surveillance system provides added insight because, unlike testing in hospital, it offers information about milder respiratory illness seen in the community.
Secondary care surveillance
We also collect surveillance data from hospitals across the country and you’ll find information about these in the weekly report.
Our Emergency Department Syndromic Surveillance System monitors the number of daily visits (from people suffering with respiratory illnesses) to a network of around 70 emergency departments across England.
We have also set up a scheme called the COVID-19 Hospitalisation in England Surveillance System, or “CHESS”, with over 130 hospitals participating and more coming on-line all the time. It is recommended that all patients with serious respiratory infections in these hospitals are tested for coronavirus, and the results are reported to PHE.
CHESS was set up specifically for surveillance purposes and is used to help us the estimate daily rate of new hospital admissions for people with COVID-19, so it may differ from other published figures such as the total number of people currently in hospital with COVID-19.
Virological surveillance
Our weekly surveillance report contains information from the Respiratory Datamart project. This is an important laboratory surveillance tool for monitoring major respiratory viruses circulating in England. We analyse samples from a sample of PHE and associated NHS laboratories based in all parts of the country and publish the percentage of tests that are positive for COVID-19 in the report. Changes in the proportion of tests that are positive are an important early indicator of changes in the incidence of infection.
Mortality surveillance
Our report includes numbers for people who have been hospitalised with confirmed COVID-19 in England and have died. We currently report on published NHS data.
The report also looks at “excess all-cause mortality”, which tracks whether the number of deaths of any cause occurring in the country is above the expected level for this time of year. This is an important indicator of deaths that may be due to COVID but where the infection not diagnosed or confirmed. It may also indicate deaths due to other causes, where COVID infection may be a contributor. For more information on deaths registered weekly (in England and Wales) visit the Office for National Statistics.
International situation
The final section of our report includes confirmed cases of COVID-19 across the world including the overall number of deaths.
Future data sources
Our weekly surveillance report and data dashboard will keep evolving as new data become available, for instance we are planning to include ethnicity data in future reports.
Opportunities to collect anonymised data will emerge from the different pillars of the Government’s testing strategy and from new tools and apps such as the NHS status tracker and systems used to scale up contact tracing.
Keep checking back on our weekly surveillance reports when they are published every Thursday on GOV.UK.
View original article
Contributor: Blog Editor