The COVID-19 pandemic led to enormous public interest in statistics, with sudden and urgent need to track the virus almost in real time. Whilst this was a big challenge for our statisticians, it led to real innovation in the way we manage and present data and statistics.
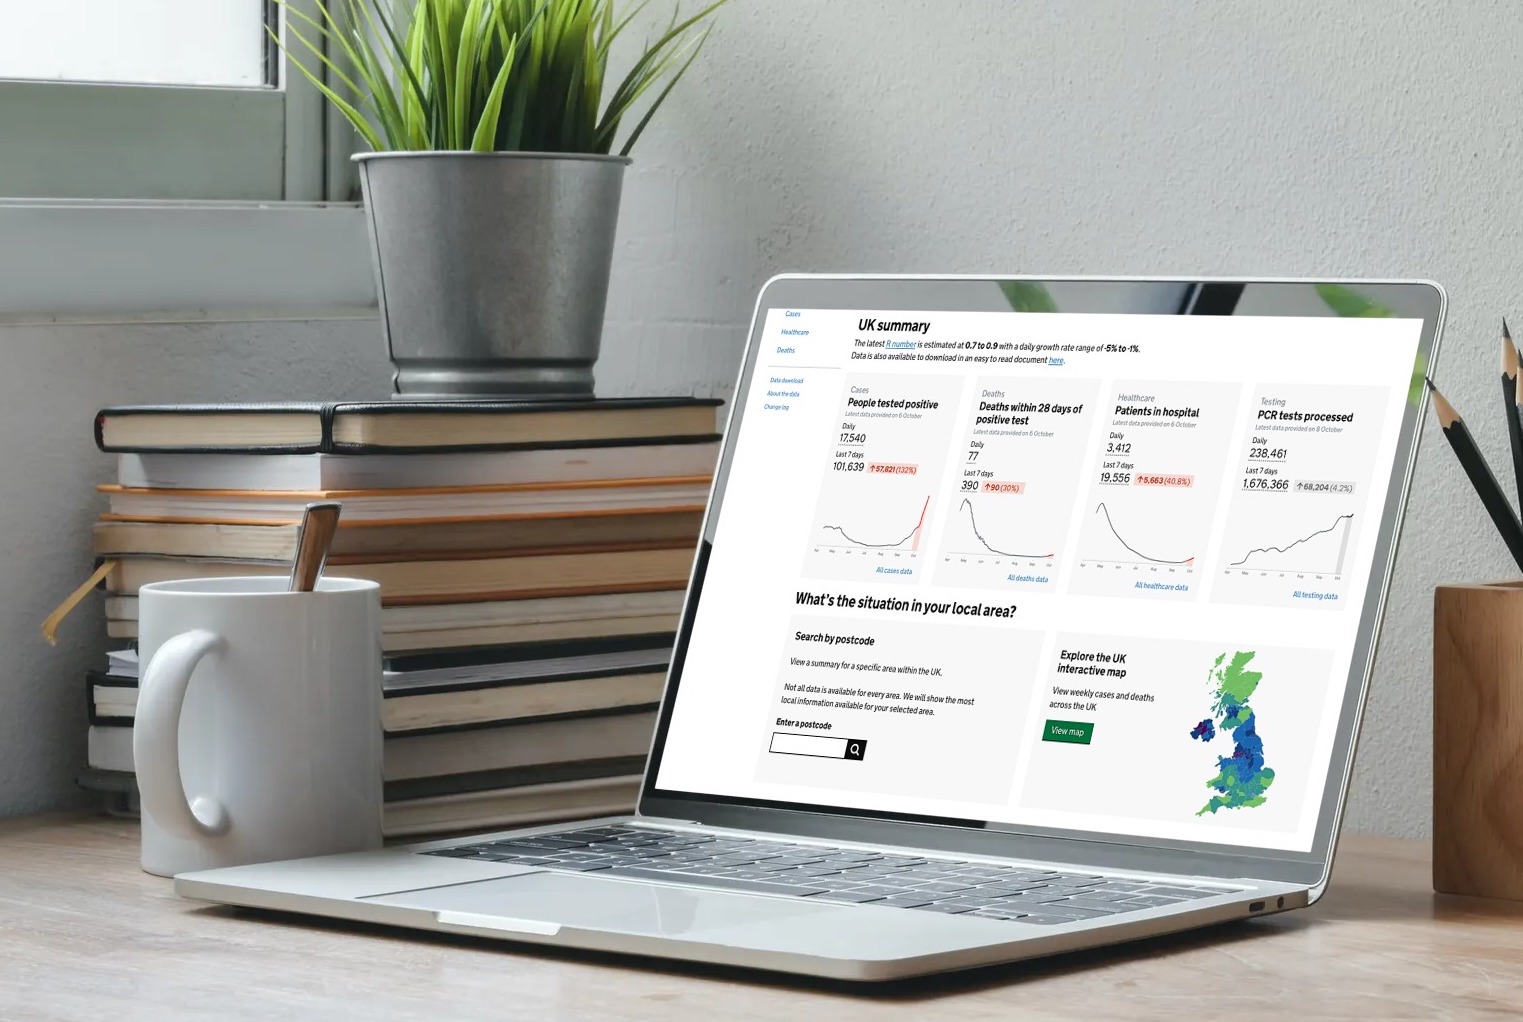
UKHSA’s COVID-19 dashboard has been a huge success in presenting daily updates on the latest situation in relation to infections and vaccinations, and it continues to be a crucial resource.
Why do we need to make changes?
Our job as statisticians is to provide the most useful and relevant information for the current situation. Now that we’ve moved to living with COVID, we need to review our reporting of COVID-19 statistics to ensure that we’re looking at the right metrics for our lives today. This has meant making changes to how we present data in the COVID-19 dashboard and COVID-19 surveillance statistics, and these changes are summarised below.
Different measures of vaccine uptake
UKHSA is currently reporting two different measures of vaccine uptake. They measure different things and shouldn’t be used interchangeably:
Administrative uptake is an operational measure that reports the total number of 1st, 2nd and 3rd doses delivered during the entire COVID-19 vaccination programme, as a proportion of the eligible population. The ONS mid-2020 population estimate is used as a measure of the eligible population.
This metric was useful at the start of the mass vaccine roll-out as a way of measuring success in delivering vaccines. It can also be calculated for all four nations of the United Kingdom and so enables some comparisons. However, it has become less useful over time: it doesn’t change much week-to-week and it focuses on the original vaccine programme which is now largely in the past.
Coverage is a much more useful way of looking at vaccine uptake now that COVID-19 and the associated vaccine programme have become embedded in our way of life. This metric reports the number of people who have been vaccinated as a proportion of the total current registered population. Crucially, for coverage, both the number vaccinated and the size of the population eligible for vaccination come from NIMS (National Immunisation Management System), a live system that includes everyone registered with the NHS.
Coverage is the statistic we use in England for reporting on vaccine uptake across all vaccine programmes. It isn’t possible to calculate this measure across all four nations that make up the United Kingdom because not all nations have a live register such as NIMS.
The WHO guidance on COVID-19 vaccination monitoring advocates using both uptake and coverage measures but acknowledges that administrative uptake becomes less useful over time. Switching our focus to coverage enables accurate monitoring in line with the WHO guidance.
You can read more about the different measures here or in the metrics section of the COVID-19 dashboard.
What changes have we made?
We are making some changes to the look of the COVID-19 dashboard and the national flu and COVID-19 surveillance statistics to focus on the vaccine coverage measures. Given that immunity wanes over time, we have also taken this opportunity to focus on the autumn booster campaign, as these are most relevant to understanding the current situation around COVID-19 vaccination.
When you open the COVID-19 dashboard from today, the first thing you will see is coverage statistics for the autumn booster campaign. Similarly, from Thursday 1 December the relevant section of the weekly COVID-19 surveillance report will be focused on the autumn booster.
These are the most relevant and useful statistics as we move from pandemic to living with COVID. As future campaigns take place we anticipate making similar changes so that we are always reporting the most useful and relevant statistics.
The administrative uptake statistics are still available via the dashboard API and in the tables that supplement the COVID-19 surveillance statistics.
What next?
We are working on further developments to the COVID-19 dashboard and the COVID-19 surveillance statistics to ensure they remain relevant, useful and consistent with best practice. We will keep you posted as we progress.
We welcome your feedback on these changes, our COVID-19 statistics or our statistical products more generally. Please get in touch at [email protected] or [email protected]
View original article
Contributor: Blog Editor